Tuesday, May 7, 2013

Tuning Fork and Palm Pipe Lab


Tuning Fork Lab: 
  In this lab, we graphed the frequency of the tuning fork by hitting it under our shoe and putting the microphone(attached to lab quest) close to the tuning fork to record the "ringing" noise it makes. Once we recorded that(analyzed-fft) we got the graph above. As you can see, the graphs are evenly spaced out which helps us figure out which harmonic it is in(7th harmonic). This graph means:
     - multiple harmonics-evenly spaced-multiples of 1st frequency
     - different heights of graphs-louder, more dominant
     - blend harmonics 

Palm Pipe Lab: 
    In this lab everyone was given a pipe(different sizes) and we were each expected to figure out what note the pipe hits. In order to figure this out we had to first measure the length of the pipe and the diameter. With these measurements we are now able to first solve for wavelength and then the frequency. Once we figured out the frequency we now can find which note it hits by typing in the frequency in Wolfram Alpha. After everyone had figured out what note they got, we played "Twinkle Twinkle Little Star" with our Palm Pipe.

Thursday, April 25, 2013

Optics&Light

Refraction:

    The law of refraction, also known as Snell's Law, is the "bending of the path of a light wave as it passes across the boundary separating two media". Meaning, the image of a refracted object seems bent, shorter than it really is, or broken. This happens because of the change in speed by a wave that 
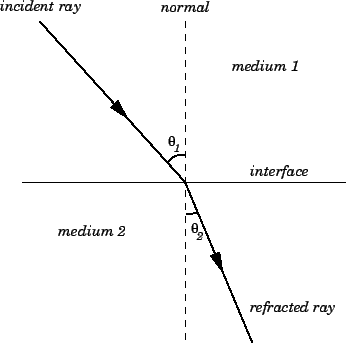
changes medium. Each object has its own index of refraction which is why the light bends for example coming from air to acrylic. Air has an index of 1.00 and acrylic has an index of 1.49. The denser the object, the higher the index.This is an example of how you can sketch refraction:

   With the info we are given, we come up with the equation for refraction or Snell's law as-->    \begin{displaymath}
n_1\,\sin\theta_1 = n_2\,\sin\theta_2,
\end{displaymath}. In the picture below shows us a real life example of refraction. So take the first glass on the left for example. The pencil seems like its broken at the bottom. The reason why it seems like that because the index of wood is 1.3 is much denser than water so the refracted ray bends more than the incident ray.

Monday, March 25, 2013

Magnetism


Standard 6.3: Explain how objects like the earth and metals can be permanent or temporary magnets.


  In this unit we learned how the earth is like a magnet. The earth is made up of various things, like the crust, mantle, outer and inner core. The core is made of metals that are dense elements, which sink. Our outer core is molten, ionized, metals. This means that these metals are moving and the charges are able to flow easily. And because the earth is also rotating, it increase the movement of charges. These charges create the earth's magnetic field. That is why the earth is a permanent magnet. Their magnetic domains are aligned, which causes their magnetic fields to add together to make a stronger field. An example of a temporary magnet would be aluminum paper clips. In aluminum, there are domains. However they all don't line up. In the presence a permanent magnet, the paper clip then becomes a temporary magnet. 


 Earth's Core:

                                       
  Here is an example of an object, like aluminum paper clips, becoming a temporary magnet when in the presence of a permanent magnet:


Monday, February 11, 2013

Electromagnetism: Lemon Battery

Real World Connection:
http://www.ilounge.com/index.php/articles/comments/best-practices-for-ipad-battery-charging/
http://inventors.about.com/od/bstartinventions/ss/How-A-Battery-Works_4.htm


    This pass week we learned about electromagnetism. We discovered how and why attraction and repulsion happen. The attraction through polarization happens because like charged objects repel, oppositely charged objects attract, and neutral and charged objects attract as well. With this concept we can understand what voltage (electrical potential) and electric potential energy is. Voltage is like a "field" surrounding charged objects. Voltage is like a mountain where negative charges run "uphill" and positive charges run "downhill" because opposites attract and like charges repel.

  With what we know about electromagnetism, we can apply this knowledge to how a lemon battery works and how an ipad battery works. Before we began the lemon battery lab, we reviewed what we know about elements. There are elements that can be easily shared or taken from like copper and zinc. In this lab, the copper helps create these electrons that reacts with zinc through the wires used, causing to light the light bulb(making energy). The battery of the ipad works the same way. The battery is like the lemon. However, this battery is called a Lithium Ion battery. These batteries contain electrons that reacts well with each other to cause the ipad to work efficiently.The positive electrons attract with negative electron when being charged. The negative electrons attract to the positive electrons when being discharged:


 For the future, technology will advanced. Ipads will become smaller and faster because of these lithium batteries. Lithium ions are said to be dominant rechargeable battery of technology for the future/present. Researches also found out that silicon can have 10 times more energy but breaks down easily. To solve this problem, polymer was develop to absorb 8 times the lithium and so far it hasn't broken down.

Monday, February 4, 2013

Projectiles

  In this lab we learned about projectile motions, which are objects projected in the air at an angle. Projectiles constantly accelerating in the force that gravity is acting on. Because we live in a 3-Dimensional world, we can analyze them separately. To help explain and better our understanding of this, we did a lab of an example of a projectile. In our groups we made projectiles by shooting a basketball. We recorded our shots into video physics and it helped us create projectile graphs:
We can analyze these graphs by the x-dimension and y-dimension:

X-Dimensions:
In this dimension we learned that the object will always be moving at constant speed in  (top graph)x-time and (bottom graph) v-t and over time it gains distance. It never speeds up or slows down.
Y-Dimension:
In this dimension we learned that the object is constantly accelerating. In top graph, the object is moving up but slowing down and when it reaches its highest point it stops moving then moving down but speeding up. In the bottom graph, the object is accelerating too, like the top graph. Its moving up but slowing down then stops moving at its highest point then continues moving down  but speeding up in the negative direction.


Tuesday, January 29, 2013

Forces in 2D


  1. What does it mean to analyze forces in 2D?
  2. How do forces cause objects to move in a circle?
  3. What does it mean to be in orbit? How do satellites orbit planets? How do planets orbit the sun?


1. What does it mean to say we live in a 3-D universe? Well it means that there are 3 different dimensions in our world. There is a 2nd, 3rd, and 4th dimension. The 2nd and 3rd dimension have x-y components while the 4th dimension has 3-Dimensions of space and 1-Dimension of time(x, y, z, t). As a result, we can analyze these dimensions separately or independent of one another. 

2.Forces cause objects to move in a circle because they must feel a net force that always points to the center of the circular path. This is called the centripetal force. In order for this to work, a string tension pointing to the center point  must be present or else the object will travel in a straight line instead of going in a circle.

3.  To be in orbit means a path taken by an object as it circles another object. It's like how satellites orbit planets and how planets orbit the sun. With the help of the centripetal force, these satellites and planets orbit follow a path that help them move in this circular motion. It is important to understand that the gravitational force puling these objects to the center and as it moves at a constant speed happens because of the string tension that isn't being disturbed by any friction, causing it to go off in a straight line. 

Sunday, November 18, 2012

Fan Cart Lab

Purpose:

    In this lab we are able to understand the relationship between force, mass, and acceleration. Because of Newtons 1st, 2nd, and 3rd law and the Four Forces in Nature we are able to understand this theory better. Visual explanations of the lab could be drawn by Free Body Diagrams and Interaction Diagrams. These diagrams show us the Four Forces in Nature that are used in different kinds of situations. 
  To figure out the relationship we used a fan cart, spring, force probe, 5 different weights, and loggerpro application. This lab will also show us the difference in the velocity and acceleration of the fan cart when we put the 5 different weights.
 

Key Information: 

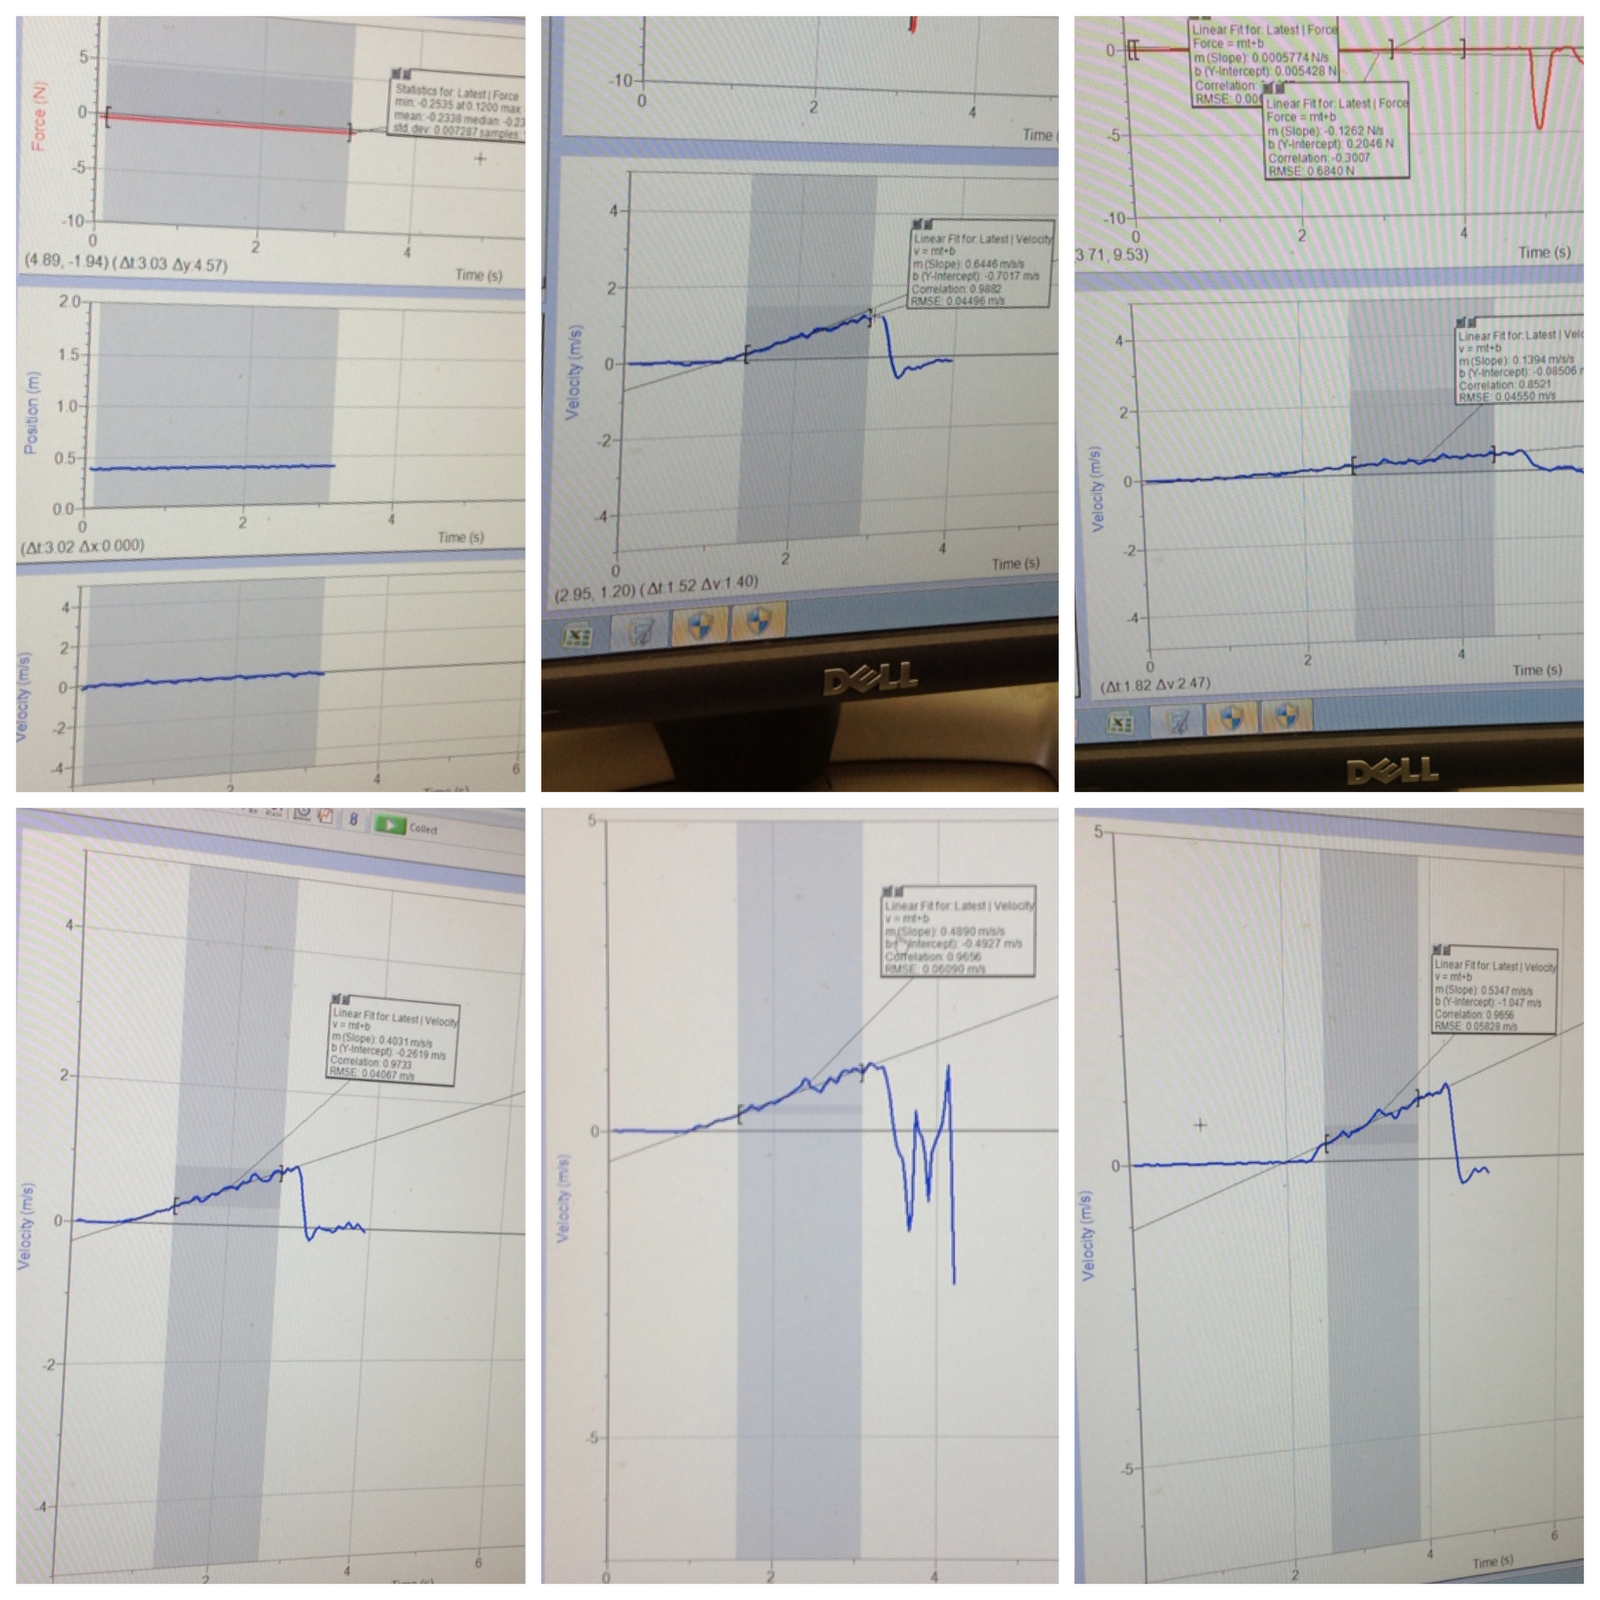
   First we measured the force of the fan cart without any weight on it and got F= .2338 N. Once we figured out the force we started to measure the slope of the velocity with 5 different weights. We  measured the heaviest weight first, which was 1 kg and measured the lightest weight last, which was .05 kg. In the graphs below(from left to right)it shows the force of the fan cart by itself, the slope of each trial with the different kinds of weight on it. 
 . 
  Once we collected all of our data we began to make an equation that describes the relationship between mass, force, and acceleration.We came up with F= ma( force=mass x acceleration). We came up with this equation because we found out that the greater the mass on an object the slower it accelerates and less mass on an object means the faster it accelerates. To test if this equation is accurate, we multiplied the mass and slope to see if the result is around .2338 N, the force. Since we did add weight onto the fan cart, we had to change the mass/weight:


Key Conclusions: 

   From this lab we found out the relationship, which is F=ma. But after we finished the lab we went into a deeper understanding of this equation. Newtons 1st law is that in an object at rest or moving at constant speed will stay that way until it experiences a net force, which leads us into the 2nd law. Because of Newtons's 2nd Law, which is that forces don't cause velocity, they only cause acceleration, the net force is required to accelerate an object. The two types of diagrams help us to visually understand this. For example, in a free body diagram an object moves 130N rightward and 80N leftward. The net force magnitude is 50N and the net force direction is right because when you move 130N and 80N you are left with 50N and since the direction is positive, the direction is to the right. And finally, Newton's 3rd Law proves that 2 forces are equal, opposite, and same type(gravity, electromagnetism). 

Ex: of Newtons Laws


Real Life Connection:

  An example of Newtons Laws would be someone in a car when it's at rest, speeding up, moving at constant speed, and slowing down. In the drawing below we see the relationship of the acceleration and velocity. When the car is speeding up the acceleration and velocity are both positive because the car is accelerating to the right(positive) and moving right(positive). When the car is moving at constant speed the acceleration is 0 and the velocity is positive because when the car is moving at constant speed, its not accelerating but the car is still moving, which is why a=o and v= +. And when the car is slowing down, a= - and v=+ because when a car is slowing down its accelerating to the left(negative) but its still moving to the right(positive).



Thursday, November 1, 2012

Impulse Lab


Purpose:
 The purpose of this lab is to understand the relationship between impulse, force, and time during a collision. Knowing this can help strengthen our knowledge more about what happens during a collision and after the collision. Impulse is about the change in momentum after a collision whether its change is negative or positive when force and time is applied. To test this we used a force probe with a spring, a cart with a spring on a ramp, and an application called LoggerPro to graph our collision.
 Key Information:
   First, it is important to understand what is an impulse( J= deltaP=Pafter-Pbefore). Impulse is the change in momentum when objects are involved in a collision and in order for this to happen we need to apply a force over time. These objects experience equal and opposite impulse because momentum is conserved.


   In this lab we started out by pushing the blue cart towards the force probe. Then with the graph we were able to record the velocity before of the blue cart, velocity after of the blue cart, and the area of force vs. time. Afterwards we were able to find the impulse of the collision= -.16. With all this information we are able to find the percent difference-- impulse - area of F x t/ impulse + area/2 X 100.

Key Conclusions:
  From what we've recorded we discovered that the relationship between impulse, force, and time is equal to each other--> J= F x t, the change in momentum is equal to the area of force-time.In other words the impulse of before and after a collision is equal but opposite. For example, we have a blue cart and a red cart involved in a collision. From there we have calculated the impulse and recorded force and time. Then we would have:

Jred= -Jblue        Jred= -Jblue
t red= t blue        deltaPred= -deltaPblue
Fred= -Fblue       delta(MredVred)= -delta(MblueVblue)
                        less mass=more velocity            more mass=less velocity

Real Life Connection:
 An example of an impulse collision would be a bullet proof vest because when someone gets shot at wearing this it prevents them from actually getting hit from the bullet. A bullet is an applied force over time and when it hits the bullet proof vest it creates an impulse( causing a change in momentum), slowing down the time when its suppose to actually hit the person's chest.


Sunday, October 28, 2012

Collisions Lab

Purpose:
In this lab we focused on the differences between what an elastic and inelastic collision is. As a result we learned which is better conserved, momentum or energy. To find out whether momentum or energy is better conserved and see the differences between inelastic and elastic collisions, we tested both collisions. We took two cars, a ramp, and a labquest machine to record the velocity of one of the cars as it moves to create a collision with the other car. From there we record the momentum and kinetic energy of each car and the total.
                     

Key Information:
 Before performing these collisions we learned a couple terms that may help us in understanding momentum. Vectors and scalars both deal with magnitude but vectors also have direction. In the first collision we performed an example of an elastic collision, which is when objects collide and bounce off. The second collision we performed was the inelastic collision, which is when objects collide and stick together. To calculate the momentum we use the equation P=mv. P stands for momentum, m stands for mass and v stands for the velocity. To find the kinetic energy we use K= 1/2mv^2.
                      Elastic Collision:
                      Inelastic Collision:

Key Conclusions:
 As a result we learned that momentum is better conserved because the momentum total before is equal to the momentum total after. In other words, it is better conserved because when one cart is moving to the right(positive) and the other is moving to the left(negative) they cancel out which makes the momentum 0 or better conserved. This connects to why direction is important for vectors. In solving for kinetic energy the positives and negative might not always cancel out, so we have to make sure we know the direction an object is moving when dealing with the kinetic energy in collisions.

Real Life Connection:
An example of an inelastic or elastic collision would be car accidents. When a cars gets into an accident sometimes one bounces off from the other or they either stick together. When one car "bounces off" from the other car its momentum continues on into the other car, causing it to move a little more after it has been hit.


Monday, October 1, 2012

Rubberband Cart Lab

Purpose: In this lab we understood the big question: How are energy and velocity related? To answer this question we used an air hockey like machine, rubber band, cart, and motion sensor. We would pull back the cart with the rubber band .01 meter back until we did .05 meters. By doing this we were able to record the velocity of the cart going through the sensor from .01 m to .05 m. We tested two trials for this lab.


Key Information:
We repeated the same procedure twice, so we pulled back the red cart .01 m, then .02 m, then .03 m, then so on until .05 m. After recording our measurements for velocity we averaged the velocity squared. By using the graphing app we were able to get a graph like this:
With this lab we figured out a visual that helps us visualize the transfer of energy from one form to another.For example, in this lab we used a rubber band to push the cart. The visual, LOL Chart, helped us see the transfer from the rubber band to the cart.


Key Conclusion:
From this graph we were able to find its slope = .528 and put it into y=mx+b form--> y=.528x + .005
This is where we figure out the relationship between energy and velocity. Instead of y=mx+b we put it into K= 1/2 mv^2. K stands for the kinetic energy which is used when an object is moving, like in this lab we measured the kinetic energy when the cart moved passed the sensor. We use 1/2m because the slope = 1/s mass of an object and the v^2 is used because we are using velocity squared to make the equation become linear. We were also able to derive another equation: Ug = (m)(g)(h). Ug stands for gravitational energy, m stands for force and h stands for the distance from the object to the ground.This is how energy and velocity are related.

Real World Connection:
A roller coaster is an example of this lab because it involves both kinetic/spring energy and gravitational force. The roller coaster car is like the cart in the lab and the rubber band is like the spring that helps push the roller coaster car, which explains why spring energy is involved. Gravitational force is used because the roller coaster car is off the ground.


Monday, September 24, 2012

Rubberband Lab

Purpose: This lab helped us to understand how we can store energy so it can do work for us later and how the force it takes to stretch a rubber band depends on the amount by which we stretch it. To understand this we used a rubber band, a machine to hold the rubber band and a force probe to measure its force. We tested different trials to find the pattern of the force.


Key Information:

Part 1: First we put the rubber band around the machine once, like in the picture above. Then we measured the the force on the rubber band for every meter we pulled. So, we took the force probe and pulled .01 m, .02 m, .03 m, and so on until .05 m and like in the Pyramid lab we used the LabQuest2 machine to find the force being put on each distance we pulled. Here is our data:
Part 2: We repeated the same steps as Part 1 but instead of putting the rubber band around the loops once we double looped it, making it harder to pull and adding even more force on the rubber band. We recorded the force of .01 m up to .05 m. As you can see, more force was used unlike in Part 1.
Key Conclusions:
After recording our data we graphed it and found the best fit line. After, we discovered the slope and found out that for every meter the rubber band is being stretched. With this information we can now use it in an equation--> Fs = k * x. F = force, little s=spring, k="spring constant"( which is 44.44 N), x= distance stretched. Now we know that energy can be stored by applying force onto an object and that the more you stretch the rubber band the more force it takes.
Real Life Connection:
A good example of this lab would be bungee jumping on a trampoline. This is like how when Mr. O'keefe held the rubber band with his two finger, storing energy for it to do work for us later. The person on the bungee cord is like the force probe pulling the rubber band/bungee cord. You can pull it using your body or jumping higher adding on more force.


Monday, September 17, 2012

Pyramid Lab

Purpose: This lab helped us understand the relationship between force, distance, and work. To understand these relationships we used a ramp, a mini cart that holds 500 g of weight, and a device called LabQuest2 that reads the force of the mini cart being pulled up the ramp. We tested 3 trials on this Pyramid lab and graphed each trial to show the "work" that's being put in.
Key Information:
  In trial 1 we first measured the stack of books, at the end of the end of the ramp, from the top of the stack of books till the bottom(table). Then, with our device we pulled the mini cart up the ramp til the end of the book on top of the stack. We recorded the flat rate of the graph and took its mean for the force. As a result we got .541 N, 1.53 m for the distance of top of the stacks of book to the bottom. and .828 J for the work.

In trial 2 we moved the stack of books a little closer to the middle of the ramp, making the angle of the ramp bigger. Same as trial 1, we measured distance of the stack of books to the bottom and then pulled the mini cart until we reached the stack of books, then recorded its mean as the force. As a result for trial 2 we got .654 N, 1.12 m, and .735 J.

In trial 3 we moved the stack of books even closer, probably in the middle of the ramp. We measured the top of the stack of books to the bottom. Afterwards we recorded its mean as the force. For this last trial we got .714 N, 1.03 m, and .735 J. 

                            
Key Conclusions:
The relationship between force, distance, and work is W= F x d. We also discovered that work is a form of energy that is conserved or stays the same. From our observations we figured out that the closer we moved the books the less work it takes to pull the mini cart up the ramp and more force requires less distance.


Real Life Connection:
A good example is a uhaul truck. These trucks have a ramp to help move heavy things onto the moving truck. These trucks have a fairly short ramp, meaning that it takes less work to go up them. Like in our lab the ramp of the uhaul truck have the same patterns of our ramp in our Pyramid Lab. If this were a longer ramp then it would take less force to push up the ramp. If it were a shorter ramp then it would take more force to push up the ramp.


Monday, September 10, 2012

Pulley Lab

Purpose:
In class last week we learned about the relationship between force and what pattern is observed. To find out these two things we tested two pulley experiments by building one lab with one pulley and another lab with two pulleys. Attached to these pulleys will be 200g of weight on each side and the second pulley will have 100 g of weight on side and 200 g of weight on the other. . By using these pulleys we can figure out the relationship and pattern by measuring the distance between the the weight to the "floor" and then  measuring the distance the second time of how much you moved the weight.

Key Information:


In Experiment 1 my group, Group 4, and I meausured .1 meters of the initial length of the weight from the floor( weight on the left). After, we pulled/moved the pulley down on the right side and measure how much the weight moved on the left from its initial position. As you can see from the picture above we ended up with .1 also. So the weight moved exactly 10 cm. from its initial position
In Experiment 2 we measured .1m of the initial length of the weight from the floor (weight on the left). Then we moved/pulled the pulley on the right and measure how much the weight on the left moved. Above you can see the distance is .05m.

Key Conlcusion:
As a result you can see that in Experiment 1 it takes .1m of force to move exactly .1m of string from the pulley and in Experiment 2 it takes .5m or half the force to move .1m of string from the pulley. As a result we concluded that force and distance are inversely proportional. The greater applied force requires less distance(like in ex.1) and the lesser applied force requires more distance(like in ex.2)

Real World Connection:


An example of a real life pulley are zip lines because it shows us a good example of how greater applied force requires less distance and that lesser applied force requires more distance. When you go zip lining sometimes you have to keep your hand/s resting at the top of the pulley, like in the picture, because when you apply force on that pulley the slower you will go, which means less distance. If you don't rest your hands at the top and applying no force at all  then the faster you will go down the zip line, which means more distance.


Tuesday, September 4, 2012

Mass vs. Force


Purpose: In class last week we learned about the relationship between mass and force. We discovered that by weighing different sizes of metal we will find the pattern between mass and force. The pattern of mass and force helps us know how much

Key Information:  In our lab we weighed 5 different sizes of metal, which were 1kg, .5kg, .2kg, .1kg, and .02 kg, and found out that the mass in 1kg requires 10 times the force in Newtons, meaning that for every 1kg there are 10 newtons. Then, once we graphed the the mass and force we talked about the best fit line, which is the pattern or theory of the lab. In this case our pattern is 10 N/kg.

Key Conclusion:  After graphing, we found out the slope/pattern by using y= mx + b. Y represents the dependent  variable, m represents the slope, x represents the independent variable, and b represents the y-intercept, which is happens to be 0 in our lab. In this case, we ended up with F= gm. F stand for force of gravity or weight, g stands for gravity( 10 N/kg ), and m stand for mass. As a result of figuring out the slope/pattern we got F= 10 N/kg m .Now that we know this, we can figure out how much force is needed upon a certain amount of mass whether on earth or another planet. Here's a visual of our lab:

Real World Connections:

http://www.youtube.com/watch?v=OSJlL4wqLGo

This link is a real life example of mass, gravity, and force because it shows us how the mass of something effects the force on gravity compared to the earth and moon. In our lab we weighed the metals and figure out how much force is needed in 1kg(mass) on earth but on the moon we discovered that there is less force on the metals when on the moon. In this youtube video, the man on the moon is able to move and jump high in his 70 lb suit because there is less force needed on the mass of the suit and man.